Einbinden von Wettervorhersagedaten in Grafana

Updates
Nachdem ich hier bereits über Tests meiner ESP-Wetterstation berichtete folgt nun eine Idee zur "Verbesserung" des Wetterberichts...
Schön wäre es, wenn man die durch die Wetterstation gemessenen und die vorhergesagten Daten auf einfache Art vergleichen könnte. Der minimale Nutzen wäre, über die Wetterfrösche schimpfen zu können, wenn sie wieder einmal danebengelegen haben obwohl man heute ja wissen sollte, dass Wettervorhersagen prinzipiell unmöglich sind.
Der größte Nutzen wäre beim Vergleich der Vorhersagen mit dem aktuell gemessenen systematische Fehler zu identifizieren - zum Beispiel, dass der vorhergesagte Temperaturwert immer um ungefähr 2 Grad niedriger liegt als der tatsächliche. Damit könnte man eine persönliche, korrigierte Vorhersage erstellen.
Diese Daten zu gewinnen ist sehr einfach: Man findet im Netz eine ganze Reihe von öffentlichen APIS, die man einfach nutzen kann. Mein Mittel der Wahl - ich benutze locationforecast in der Version 2.0.
Dieser Service liefert die Daten als JSON. Ich überlegte kurz, ob ich versuchen sollte, Telegraf die Struktur der Daten klarzumachen, entschied mich aber dagegen. Ich schrieb ein kleines Python-Script, das für mich die Aufbereitung der Daten übernimmt und sie in eine InfluxDB schreibt. Voraussetzung für die Funktion des Skripts ist die Installation des Python-Moduls influxdb, was über den Befehl
pip3 install influxdb
geschehen kann - man beachte, dass hier unbedingt pip3 benutzt werden muss und nicht pip, da das Skript Python in der Version 3 voraussetzt. Würde man hier pip benutzen, würde das Modul für Python in der Version 2 installiert und Python 3 würde sich weiterhin beschweren, dass es das Modul nicht finden kann!
#!/usr/bin/env python3
from influxdb import InfluxDBClient
import requests
import json
import datetime
import socket

# host of the influxdb used to store the data
influxhost=''
# port of the influxdb used to store the data
influxport=
# username for accessing the influxdb used to store the data
influxusername''
# password for accessing the influxdb used to store the data
influxpassword=''
# name of the influxdb database used to store the data
monitoringdbname=''
# user agent (python requests standard user agent is blocked by the api
useragent='Mozilla/5.0 (X11; Linux x86_64; rv:10.0) Gecko/20100101 Firefox/10.0'
# latitude of the location the forecast is wanted for (german: Breitengrad)
latitude=
# longitude of the location the forecast is wanted for (german: Längengrad)
longitude=
# API url
url='https://api.met.no/weatherapi/locationforecast/2.0/.json?lat={latitude}&lon={longitude}'.format(latitude=latitude,longitude=longitude)
# name of the location the forecast is wanted for (german: Längengrad)
locality=""
# value for the host tag when writing to the influxdb
monitoringhost=socket.getfqdn()
# if you want the ip address rather than the hosts name, do
# monitoringhost=socket.gethostbyname(socket.getfqdn())

client = InfluxDBClient(host=influxhost, port=influxport)
# if influx requires authentication, use the following line instead of the one above:
# client = InfluxDBClient(host=influxhost, port=influxport,username=influxusername, password=influxpasword)

databases = client.get_list_database()

databaseAlreadyThere =False

for item in databases:
    if item['name'] == monitoringdbname:
        databaseAlreadyThere = True

if databaseAlreadyThere == False:
    client.create_database(monitoringdbname)

client.switch_database(monitoringdbname)

headers = {
    'User-Agent': useragent
}

# print(url)
response = requests.get(url, headers=headers)
# print(response.content)
data = json.loads(response.content.decode('utf-8'))
timeseries=data['properties']['timeseries']
lon=data['geometry']['coordinates'][0]
lat=data['geometry']['coordinates'][1]
height=str(float(data['geometry']['coordinates'][2])*0.3048)
json_bodies=[]
for timeserie in timeseries:
    stats = {}
    data=timeserie['data']['instant']['details']
    for x in data:
        if isinstance(data[x],dict)==False:
            stats[x] = data[x]
    if 'next_1_hours' in timeserie['data'].keys():
        stats['precipitation_amount']=timeserie['data']['next_1_hours']['details']['precipitation_amount']
    json_body = []
    jb={}
    jb["measurement"]="WeatherForecast"
    tags={}
    tags["Server"]=monitoringhost
    tags["Longitude"]=lon
    tags["Latitude"]=lat
    tags["Height"]=height
    tags["Location"]=locality
    jb["tags"]=tags
    jb["time"]=timeserie['time']
    jb["fields"]=stats
    json_body.append(jb)
    client.write_points(json_body)
Führt man dieses Skript - zum Beispiel per Cron - stündlich aus, werden jeweils akuelle Vorhersagedaten in die Datenbank geschrieben, wobei InfluxDB von selbst Daten für Zeitpunkte, für die von früheren Vorhersagen bereits Informationen vorhanden sind mit den aktuelleren überschreibt.
Nun füge man noch ein wenig Grafana-Magie hinzu und erstellt sich in wenigen Minuten das erste Dashboard zur Anzeige des Wetters der nächsten 48 Stunden:
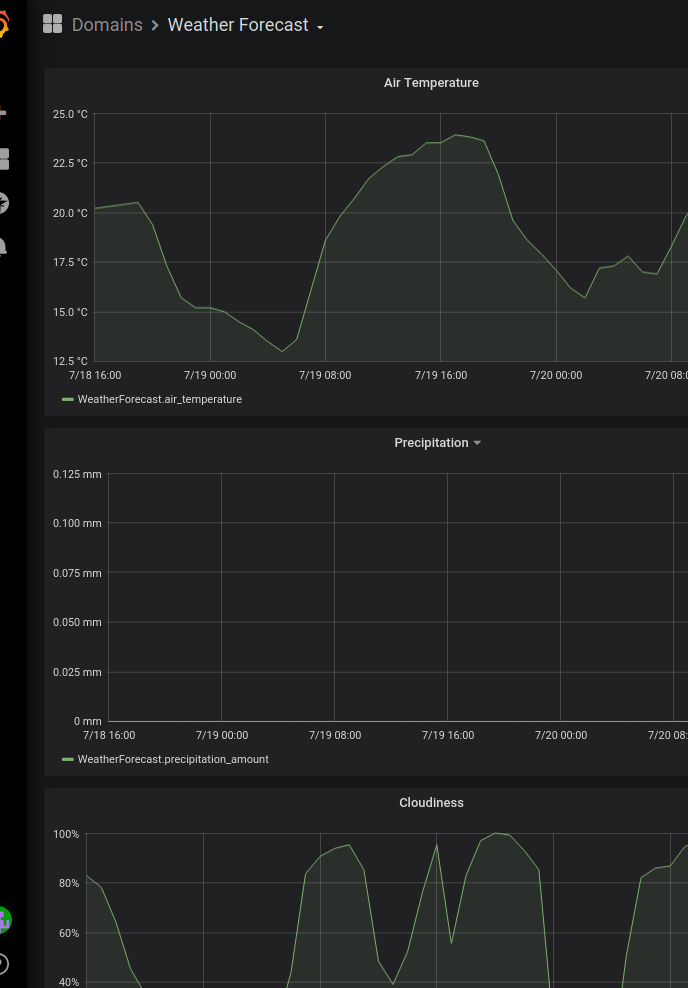 Wettervorhersage
{
"annotations": {
"list": [
{
"builtIn": 1,
"datasource": "-- Grafana --",
"enable": true,
"hide": true,
"iconColor": "rgba(0, 211, 255, 1)",
"name": "Annotations & Alerts",
"type": "dashboard"
}
]
},
"editable": true,
"gnetId": null,
"graphTooltip": 0,
"id": 30,
"links": [],
"panels": [
{
"aliasColors": {},
"bars": false,
"dashLength": 10,
"dashes": false,
"fill": 1,
"gridPos": {
"h": 9,
"w": 12,
"x": 0,
"y": 0
},
"id": 2,
"legend": {
"avg": false,
"current": false,
"max": false,
"min": false,
"show": true,
"total": false,
"values": false
},
"lines": true,
"linewidth": 1,
"links": [],
"nullPointMode": "null",
"options": {},
"percentage": false,
"pointradius": 2,
"points": false,
"renderer": "flot",
"seriesOverrides": [],
"spaceLength": 10,
"stack": false,
"steppedLine": false,
"targets": [
{
"groupBy": [],
"measurement": "WeatherForecast",
"orderByTime": "ASC",
"policy": "default",
"refId": "A",
"resultFormat": "time_series",
"select": [
[
{
"params": [
"air_temperature"
],
"type": "field"
}
]
],
"tags": [
{
"key": "Location",
"operator": "=",
"value": "Rudolstadt"
}
]
}
],
"thresholds": [],
"timeFrom": null,
"timeRegions": [],
"timeShift": null,
"title": "Air Temperature",
"tooltip": {
"shared": true,
"sort": 0,
"value_type": "individual"
},
"type": "graph",
"xaxis": {
"buckets": null,
"mode": "time",
"name": null,
"show": true,
"values": []
},
"yaxes": [
{
"format": "celsius",
"label": null,
"logBase": 1,
"max": null,
"min": null,
"show": true
},
{
"format": "short",
"label": null,
"logBase": 1,
"max": null,
"min": null,
"show": true
}
],
"yaxis": {
"align": false,
"alignLevel": null
}
},
{
"aliasColors": {},
"bars": false,
"dashLength": 10,
"dashes": false,
"fill": 1,
"gridPos": {
"h": 9,
"w": 12,
"x": 12,
"y": 0
},
"id": 7,
"legend": {
"avg": false,
"current": false,
"max": false,
"min": false,
"show": true,
"total": false,
"values": false
},
"lines": true,
"linewidth": 1,
"links": [],
"nullPointMode": "null",
"options": {},
"percentage": false,
"pointradius": 2,
"points": false,
"renderer": "flot",
"seriesOverrides": [],
"spaceLength": 10,
"stack": false,
"steppedLine": false,
"targets": [
{
"groupBy": [],
"measurement": "WeatherForecast",
"orderByTime": "ASC",
"policy": "default",
"refId": "A",
"resultFormat": "time_series",
"select": [
[
{
"params": [
"precipitation_amount"
],
"type": "field"
}
]
],
"tags": [
{
"key": "Location",
"operator": "=",
"value": "Rudolstadt"
}
]
}
],
"thresholds": [],
"timeFrom": null,
"timeRegions": [],
"timeShift": null,
"title": "Precipitation",
"tooltip": {
"shared": true,
"sort": 0,
"value_type": "individual"
},
"type": "graph",
"xaxis": {
"buckets": null,
"mode": "time",
"name": null,
"show": true,
"values": []
},
"yaxes": [
{
"format": "lengthmm",
"label": null,
"logBase": 1,
"max": null,
"min": null,
"show": true
},
{
"format": "short",
"label": null,
"logBase": 1,
"max": null,
"min": null,
"show": true
}
],
"yaxis": {
"align": false,
"alignLevel": null
}
},
{
"aliasColors": {},
"bars": false,
"dashLength": 10,
"dashes": false,
"fill": 1,
"gridPos": {
"h": 9,
"w": 12,
"x": 0,
"y": 9
},
"id": 4,
"legend": {
"avg": false,
"current": false,
"max": false,
"min": false,
"show": true,
"total": false,
"values": false
},
"lines": true,
"linewidth": 1,
"links": [],
"nullPointMode": "null",
"options": {},
"percentage": false,
"pointradius": 2,
"points": false,
"renderer": "flot",
"seriesOverrides": [],
"spaceLength": 10,
"stack": false,
"steppedLine": false,
"targets": [
{
"groupBy": [],
"measurement": "WeatherForecast",
"orderByTime": "ASC",
"policy": "default",
"refId": "A",
"resultFormat": "time_series",
"select": [
[
{
"params": [
"cloud_area_fraction"
],
"type": "field"
}
]
],
"tags": [
{
"key": "Location",
"operator": "=",
"value": "Rudolstadt"
}
]
}
],
"thresholds": [],
"timeFrom": null,
"timeRegions": [],
"timeShift": null,
"title": "Cloudiness",
"tooltip": {
"shared": true,
"sort": 0,
"value_type": "individual"
},
"type": "graph",
"xaxis": {
"buckets": null,
"mode": "time",
"name": null,
"show": true,
"values": []
},
"yaxes": [
{
"decimals": null,
"format": "percent",
"label": null,
"logBase": 1,
"max": "100",
"min": "0",
"show": true
},
{
"format": "short",
"label": null,
"logBase": 1,
"max": null,
"min": null,
"show": true
}
],
"yaxis": {
"align": false,
"alignLevel": null
}
},
{
"aliasColors": {},
"bars": false,
"dashLength": 10,
"dashes": false,
"fill": 1,
"gridPos": {
"h": 9,
"w": 12,
"x": 12,
"y": 9
},
"id": 3,
"legend": {
"avg": false,
"current": false,
"max": false,
"min": false,
"show": true,
"total": false,
"values": false
},
"lines": true,
"linewidth": 1,
"links": [],
"nullPointMode": "null",
"options": {},
"percentage": false,
"pointradius": 2,
"points": false,
"renderer": "flot",
"seriesOverrides": [],
"spaceLength": 10,
"stack": false,
"steppedLine": false,
"targets": [
{
"groupBy": [],
"measurement": "WeatherForecast",
"orderByTime": "ASC",
"policy": "default",
"refId": "A",
"resultFormat": "time_series",
"select": [
[
{
"params": [
"air_pressure_at_sea_level"
],
"type": "field"
}
]
],
"tags": [
{
"key": "Location",
"operator": "=",
"value": "Rudolstadt"
}
]
}
],
"thresholds": [],
"timeFrom": null,
"timeRegions": [],
"timeShift": null,
"title": "Air Pressure At Sea Level",
"tooltip": {
"shared": true,
"sort": 0,
"value_type": "individual"
},
"type": "graph",
"xaxis": {
"buckets": null,
"mode": "time",
"name": null,
"show": true,
"values": []
},
"yaxes": [
{
"decimals": null,
"format": "pressurehpa",
"label": null,
"logBase": 1,
"max": "1061",
"min": "954",
"show": true
},
{
"format": "short",
"label": null,
"logBase": 1,
"max": null,
"min": null,
"show": true
}
],
"yaxis": {
"align": false,
"alignLevel": null
}
},
{
"aliasColors": {},
"bars": false,
"dashLength": 10,
"dashes": false,
"fill": 1,
"gridPos": {
"h": 9,
"w": 12,
"x": 0,
"y": 18
},
"id": 6,
"legend": {
"avg": false,
"current": false,
"max": false,
"min": false,
"show": true,
"total": false,
"values": false
},
"lines": true,
"linewidth": 1,
"links": [],
"nullPointMode": "null",
"options": {},
"percentage": false,
"pointradius": 2,
"points": false,
"renderer": "flot",
"seriesOverrides": [],
"spaceLength": 10,
"stack": false,
"steppedLine": false,
"targets": [
{
"groupBy": [],
"measurement": "WeatherForecast",
"orderByTime": "ASC",
"policy": "default",
"refId": "A",
"resultFormat": "time_series",
"select": [
[
{
"params": [
"relative_humidity"
],
"type": "field"
}
]
],
"tags": [
{
"key": "Location",
"operator": "=",
"value": "Rudolstadt"
}
]
}
],
"thresholds": [],
"timeFrom": null,
"timeRegions": [],
"timeShift": null,
"title": "Relative Humidity",
"tooltip": {
"shared": true,
"sort": 0,
"value_type": "individual"
},
"type": "graph",
"xaxis": {
"buckets": null,
"mode": "time",
"name": null,
"show": true,
"values": []
},
"yaxes": [
{
"decimals": null,
"format": "percent",
"label": null,
"logBase": 1,
"max": "100",
"min": "0",
"show": true
},
{
"format": "short",
"label": null,
"logBase": 1,
"max": null,
"min": null,
"show": true
}
],
"yaxis": {
"align": false,
"alignLevel": null
}
},
{
"aliasColors": {},
"bars": false,
"dashLength": 10,
"dashes": false,
"fill": 1,
"gridPos": {
"h": 9,
"w": 12,
"x": 12,
"y": 18
},
"id": 5,
"legend": {
"avg": false,
"current": false,
"max": false,
"min": false,
"show": true,
"total": false,
"values": false
},
"lines": true,
"linewidth": 1,
"links": [],
"nullPointMode": "null",
"options": {},
"percentage": false,
"pointradius": 2,
"points": false,
"renderer": "flot",
"seriesOverrides": [],
"spaceLength": 10,
"stack": false,
"steppedLine": false,
"targets": [
{
"groupBy": [],
"measurement": "WeatherForecast",
"orderByTime": "ASC",
"policy": "default",
"refId": "A",
"resultFormat": "time_series",
"select": [
[
{
"params": [
"dew_point_temperature"
],
"type": "field"
}
]
],
"tags": [
{
"key": "Location",
"operator": "=",
"value": "Rudolstadt"
}
]
}
],
"thresholds": [],
"timeFrom": null,
"timeRegions": [],
"timeShift": null,
"title": "Dewpoint Temperature",
"tooltip": {
"shared": true,
"sort": 0,
"value_type": "individual"
},
"type": "graph",
"xaxis": {
"buckets": null,
"mode": "time",
"name": null,
"show": true,
"values": []
},
"yaxes": [
{
"format": "celsius",
"label": null,
"logBase": 1,
"max": null,
"min": null,
"show": true
},
{
"format": "short",
"label": null,
"logBase": 1,
"max": null,
"min": null,
"show": true
}
],
"yaxis": {
"align": false,
"alignLevel": null
}
}
],
"refresh": "30m",
"schemaVersion": 18,
"style": "dark",
"tags": [],
"templating": {
"list": []
},
"time": {
"from": "now",
"to": "now+48h"
},
"timepicker": {
"refresh_intervals": [
"5s",
"10s",
"30s",
"1m",
"5m",
"15m",
"30m",
"1h",
"2h",
"1d"
],
"time_options": [
"5m",
"15m",
"1h",
"6h",
"12h",
"24h",
"2d",
"7d",
"30d"
]
},
"timezone": "",
"title": "Weather Forecast",
"uid": "OPvZAazRz",
"version": 6
}
Aktualisierung vom 20. November 2021
Artikel, die hierher verlinken
Preisvergleich mit historischen Daten in Grafana
19.09.2023
Durch diesen Mastodon-Thread aufmerksam geworden, wollte ich da auch unbedingt mitspielen - allerdings habe ich gerade Urlaub und daher wollte ich klein anfangen...
Wetter, Opendata und Python
23.08.2022
Ich habe während der Hitzewelle ein kleines Projekt gesucht, um mir drinnen die Zeit zu vertreiben...
Überwachung Festplattenstatus mit Grafana
15.02.2022
Ich hatte nach dem Update meines Raid mit größeren Platten festgestellt, dass der automatische Standby nach einiger Zeit Nicht-Benutzung nicht mehr funktionierte.
Proxmox-Experimente
05.09.2020
Seit ich davon gehört habe war ich neugierig auf Proxmox und wie das Versprechen von Hochverfügbarkeit damit umgesetzt werden kann. In der Firma, in der ich arbeite wird dieses System auf einem experimentellen Blech-Cluster bereits seit einiger Zeit betrieben - Zeit alse, selber einiger Erfahrungen zu sammeln


![]()
![]()


![]()
Vor 5 Jahren hier im Blog
-
Alte Rechner zukunftsfähig (?)
01.05.2019
Ich mache immer wieder gerne Experimente mit Terminalsessions - meistens wegen der zentral möglichen Administration. Nunhabe ich das Thema von neuem angepackt: wegen einem alten(sehr alten) Laptop, der bei mir schon so lange im Schrank lag, dass sogar die BIOS-Batterie inzwischen leer war...
Weiterlesen...
Tags
Android Basteln C und C++ Chaos Datenbanken Docker dWb+ ESP Wifi Garten Geo Git(lab|hub) Go GUI Gui Hardware Java Jupyter Komponenten Links Linux Markdown Markup Music Numerik PKI-X.509-CA Python QBrowser Rants Raspi Revisited Security Software-Test sQLshell TeleGrafana Verschiedenes Video Virtualisierung Windows Upcoming...
Neueste Artikel
- Graphics2D Implementierung für Java mit verlegtem Koordinatenursprung
Es gibt seit vielen Jahren immer mal wieder Leute, die im Internet fragen, ob man in Javas diversen Methoden zum Zeichnen von Graphiken das Koordinatensystem so ändern könnte, dass sich der Koordinatenursprung links unten befindet und die positive y-Achse nach oben weist. Meist sind die Antworten dann, dass eine Affine Transformation eingeschaltet werden solle, die das Bild spiegelt.
Weiterlesen... - Unerwartete Probleme bei der Software Raid5 Erweiterung
Ich bin an die Grenzen meiner Storagelösung gestoßen - es musste mehr Platz her...
Weiterlesen... - Die sQLshell ist nun cloudnative!
Die sQLshell hat eine weitere Integration erfahren - obwohl ich eigentlich selber nicht viel dazu tun musste: Es existiert ein Projekt/Produkt namens steampipe, dessen Slogan ist select * from cloud; - Im Prinzip eine Wrapperschicht um diverse (laut Eigenwerbung mehr als 140) (cloud) data sources.
Weiterlesen...
Manche nennen es Blog, manche Web-Seite - ich schreibe hier hin und wieder über meine Erlebnisse, Rückschläge und Erleuchtungen bei meinen Hobbies.
Wer daran teilhaben und eventuell sogar davon profitieren möchte, muß damit leben, daß ich hin und wieder kleine Ausflüge in Bereiche mache, die nichts mit IT, Administration oder Softwareentwicklung zu tun haben.
Ich wünsche allen Lesern viel Spaß und hin und wieder einen kleinen AHA!-Effekt...
PS: Meine öffentlichen GitHub-Repositories findet man hier - meine öffentlichen GitLab-Repositories finden sich dagegen hier.