SystemD Status Überwachung
Ich habe neulich eine alte Idee wieder hervorgeholt und ein wenig aufpoliert. Wer Server - oder generell Rechner - mit einer Vielzahl von SystemD-Service-Units am Start hat und bereits einige Aspekte davon per Telegraf, Influx und Grafana überwacht könnte daraus vielleicht ebenfalls Nutzen ziehen:
Ich habe dafür ein kleines Python-Skript geschrieben, das den Status von SystemD-Service-Units ausliest. Voraussetzung ist Python in der Version 3 und die Library parsedatetime - eventuell zu installieren mitels pip3 install parsedatetime
#! /usr/bin/env python

# Getting SystemD services status and uptime
# Alexey Nizhegolenko 2018

import os
import re
import json
import subprocess
import configparser
import parsedatetime
from datetime import datetime

def service_stat(service):
    out = subprocess.Popen(["systemctl", "status", service], stdout=subprocess.PIPE) # NOQA
    output, err = out.communicate()

    service_regx = r"Loaded:.*\/([^ ]*);"
    status_regx = r"Active:(.*) since (.*);(.*)"
    status_regx_fail = r"Active:(.*) ([^ ]+) since (.*);(.*)"

    service_status = {}

    for line in output.splitlines():
        # Match string like: name.service - Some Application Decription
        service_search = re.search(service_regx, line.decode('utf-8'))
        if service_search:
            service_status['service'] = service_search.group(1)
            continue
        # Match string like: Active: inactive (dead) since Wed 2018-09-19 10:57:30 EEST; 4min 26s ago  # NOQA
        status_search = re.search(status_regx, line.decode('utf-8'))
        status_search_f = re.search(status_regx_fail, line.decode('utf-8'))

        if status_search:
            status = status_search.group(1).strip()
            status_fail = status_search_f.group(1).strip()
            if status == 'active (running)':
                service_status['status'] = 1
            elif status == 'inactive (dead)':
                service_status['status'] = 3
            elif status_fail == 'failed':
                service_status['status'] = 4
            else:
                service_status['status'] = 0

            # Get and convert "since" date in to seconds
            since_date = status_search.group(2).strip()
            cal = parsedatetime.Calendar()
            time_struct, parse_status = cal.parse(since_date)
            delta = datetime.now() - datetime(*time_struct[:6])
            seconds = delta.total_seconds()
            service_status['status_time'] = int(seconds)
            break

    return service_status

if __name__ == '__main__':

    def main():

        os.environ["LC_ALL"] = "C"

        # Getting params from config
        pwd = os.path.abspath(os.path.dirname(os.path.realpath(__file__)))
        config = configparser.ConfigParser()
        config.read('%s/services_settings.ini' % pwd)

        services = config.get('SERVICES', 'name').split()

        # Run loop with service63s
        output = []
        for name in services:
            output.append(service_stat(name))
        print(json.dumps(output))

    try:
        main()
    except KeyboardInterrupt:
        os.system('clear')
Das Skript benötigt noch eine Information dazu, welche der vielen Service-Units genau überwacht werden sollen. Eine Liste der möglichen Kandidaten kann man mittels erhalten, die benötigte ini-Datei könnte dann zum Beispiel wie folgt aussehen:
[SERVICES]
name = atd.service blinkstickmqtt.service cron.service hd-idle.service hddtemp.service iscsid.service libvirtd.service
Diese Daten werden durch das Skript so aufbereitet, dass sie über Telegraf erfasst werden können - dazu benütigt man lediglich die Definition eines exex-input wie im folgenden Beispiel:
[[inputs.exec]]
  commands = [ "python /opt/telegraf/service.py" ]
  name_override = "services_stats"
  timeout = "10s"
  tag_keys = ["service"]
  data_format = "json"
Zusammen mit dem entsprechenden Grafana-Dashboard kann man dann eine Visualisierung wie zum Beispiel diese hier erstellen (JSON des Dashboards für den Import am Ende dieses Artikels...
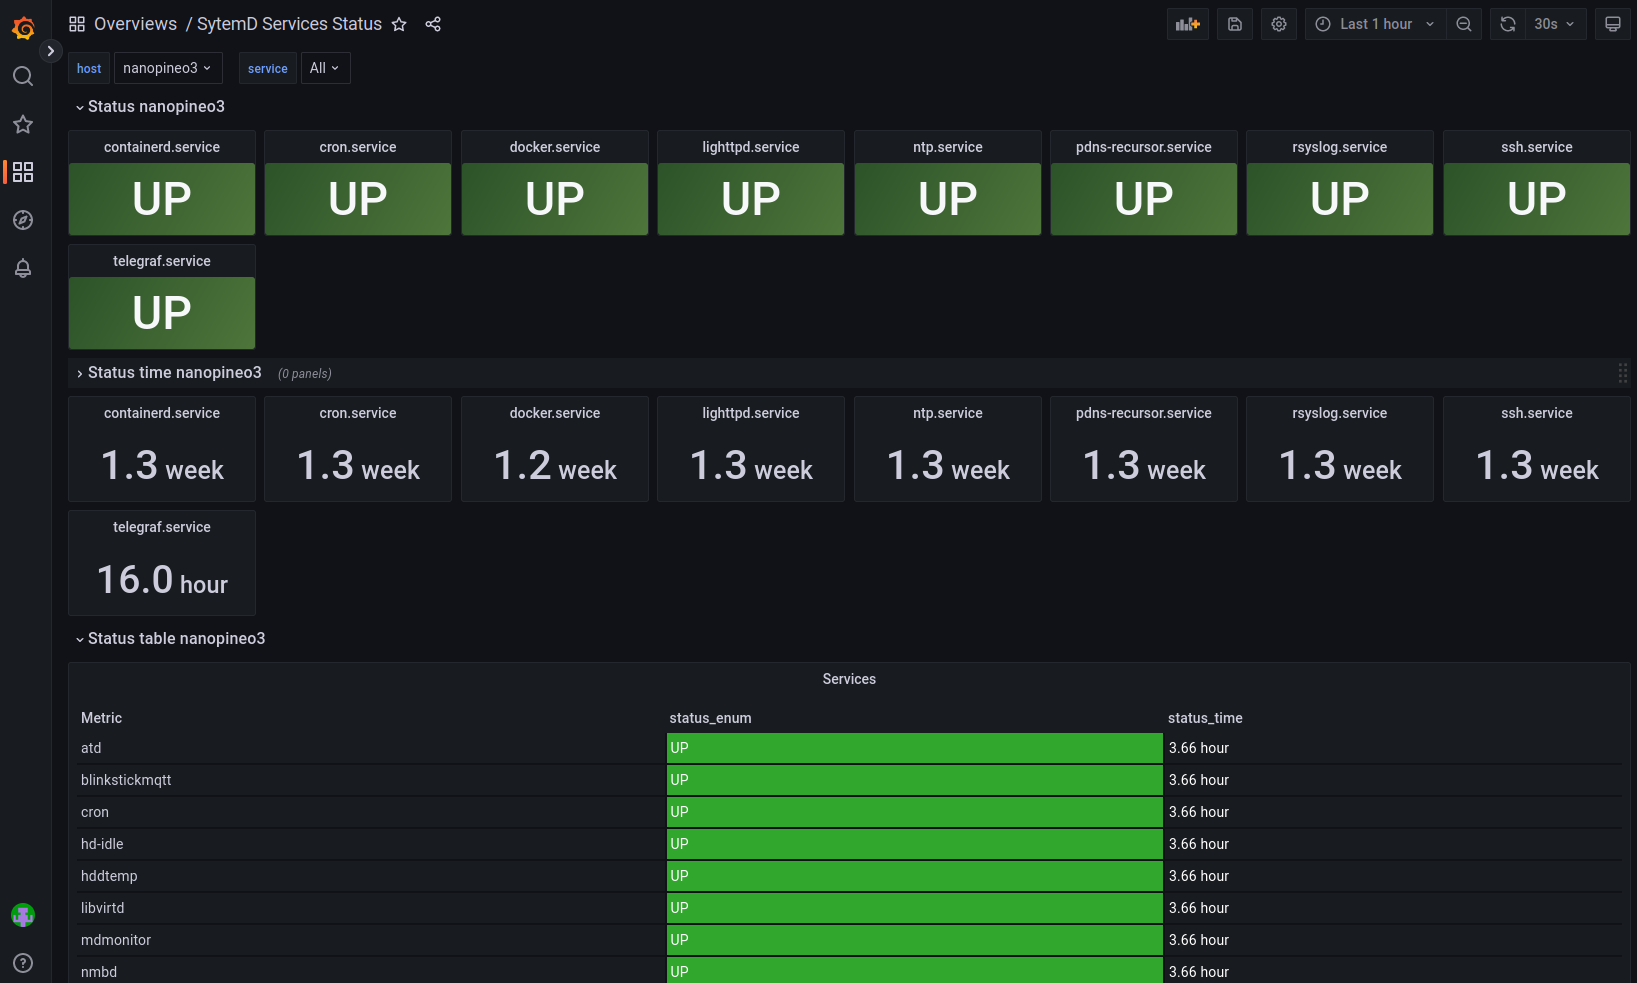 Beispiel-Dashboard zur Überwachung von SystemD-Service-Units
{
"annotations": {
"list": [
{
"builtIn": 1,
"datasource": {
"type": "datasource",
"uid": "grafana"
},
"enable": true,
"hide": true,
"iconColor": "rgba(0, 211, 255, 1)",
"name": "Annotations & Alerts",
"target": {
"limit": 100,
"matchAny": false,
"tags": [],
"type": "dashboard"
},
"type": "dashboard"
}
]
},
"description": "SystemD services status dashboard for the python script for Telegraf exec plugin.",
"editable": true,
"fiscalYearStartMonth": 0,
"gnetId": 8348,
"graphTooltip": 0,
"id": 71,
"links": [],
"liveNow": false,
"panels": [
{
"collapsed": false,
"datasource": {
"type": "influxdb",
"uid": "000000001"
},
"gridPos": {
"h": 1,
"w": 24,
"x": 0,
"y": 0
},
"id": 6,
"panels": [],
"repeat": "host",
"repeatDirection": "h",
"targets": [
{
"datasource": {
"type": "influxdb",
"uid": "000000001"
},
"refId": "A"
}
],
"title": "Status $host",
"type": "row"
},
{
"datasource": {
"type": "influxdb",
"uid": "000000001"
},
"fieldConfig": {
"defaults": {
"color": {
"mode": "thresholds"
},
"mappings": [
{
"options": {
"0": {
"index": 0,
"text": "N/A"
},
"1": {
"index": 1,
"text": "UP"
},
"3": {
"index": 2,
"text": "Down"
},
"4": {
"index": 3,
"text": "FAIL"
}
},
"type": "value"
},
{
"options": {
"match": "null",
"result": {
"color": "dark-red",
"index": 4
}
},
"type": "special"
}
],
"thresholds": {
"mode": "absolute",
"steps": [
{
"color": "rgb(0, 0, 0)",
"value": null
},
{
"color": "#508642",
"value": 1
},
{
"color": "#bf1b00",
"value": 3
}
]
},
"unit": "none"
},
"overrides": []
},
"gridPos": {
"h": 3,
"w": 3,
"x": 0,
"y": 1
},
"id": 2,
"links": [],
"maxDataPoints": 100,
"maxPerRow": 8,
"options": {
"colorMode": "background",
"graphMode": "none",
"justifyMode": "auto",
"orientation": "horizontal",
"reduceOptions": {
"calcs": [
"lastNotNull"
],
"fields": "",
"values": false
},
"textMode": "auto"
},
"pluginVersion": "9.3.2",
"repeat": "service",
"repeatDirection": "h",
"targets": [
{
"alias": "$service",
"datasource": {
"type": "influxdb",
"uid": "000000001"
},
"groupBy": [],
"measurement": "services_stats",
"orderByTime": "ASC",
"policy": "default",
"refId": "A",
"resultFormat": "time_series",
"select": [
[
{
"params": [
"status"
],
"type": "field"
}
]
],
"tags": [
{
"key": "host",
"operator": "=~",
"value": "/^$host$/"
},
{
"condition": "AND",
"key": "service",
"operator": "=~",
"value": "/^$service$/"
}
]
}
],
"title": "$service",
"type": "stat"
},
{
"collapsed": true,
"gridPos": {
"h": 1,
"w": 24,
"x": 0,
"y": 7
},
"id": 60,
"panels": [],
"title": "Status time $host",
"type": "row"
},
{
"datasource": {
"type": "influxdb",
"uid": "000000001"
},
"fieldConfig": {
"defaults": {
"color": {
"mode": "thresholds"
},
"decimals": 1,
"mappings": [
{
"options": {
"match": "null",
"result": {
"text": "N/A"
}
},
"type": "special"
}
],
"thresholds": {
"mode": "absolute",
"steps": [
{
"color": "green",
"value": null
},
{
"color": "red",
"value": 80
}
]
},
"unit": "s"
},
"overrides": []
},
"gridPos": {
"h": 3,
"w": 3,
"x": 0,
"y": 8
},
"id": 4,
"links": [],
"maxDataPoints": 100,
"maxPerRow": 8,
"options": {
"colorMode": "none",
"graphMode": "none",
"justifyMode": "auto",
"orientation": "horizontal",
"reduceOptions": {
"calcs": [
"lastNotNull"
],
"fields": "",
"values": false
},
"textMode": "auto"
},
"pluginVersion": "9.3.2",
"repeat": "service",
"repeatDirection": "h",
"targets": [
{
"datasource": {
"type": "influxdb",
"uid": "000000001"
},
"groupBy": [],
"measurement": "services_stats",
"orderByTime": "ASC",
"policy": "default",
"refId": "A",
"resultFormat": "time_series",
"select": [
[
{
"params": [
"status_time"
],
"type": "field"
},
{
"params": [],
"type": "last"
}
]
],
"tags": [
{
"key": "host",
"operator": "=~",
"value": "/^$host$/"
},
{
"condition": "AND",
"key": "service",
"operator": "=~",
"value": "/^$service$/"
}
]
}
],
"title": "$service",
"type": "stat"
},
{
"collapsed": false,
"datasource": {
"type": "influxdb",
"uid": "000000001"
},
"gridPos": {
"h": 1,
"w": 24,
"x": 0,
"y": 14
},
"id": 28,
"panels": [],
"targets": [
{
"datasource": {
"type": "influxdb",
"uid": "000000001"
},
"refId": "A"
}
],
"title": "Status table $host",
"type": "row"
},
{
"activePatternIndex": 1,
"datasource": {
"type": "influxdb",
"uid": "000000001"
},
"debug_mode": false,
"defaultPattern": {
"bgColors": "green|orange|red",
"col_name": "Value",
"decimals": 2,
"delimiter": ".",
"enable_bgColor": false,
"enable_time_based_thresholds": false,
"enable_transform": false,
"filter": {
"value_above": "",
"value_below": ""
},
"format": "none",
"null_color": "darkred",
"null_value": "No data",
"row_name": "_series_",
"thresholds": "70,90",
"time_based_thresholds": [],
"transform_values": "_value_|_value_|_value_",
"valueName": "avg"
},
"default_title_for_rows": "Metric",
"gridPos": {
"h": 11,
"w": 24,
"x": 0,
"y": 15
},
"id": 32,
"links": [],
"nullPointMode": "connected",
"patterns": [
{
"bgColors": "black|green|red",
"col_name": "_1_",
"decimals": 2,
"delimiter": ".",
"enable_bgColor": true,
"enable_time_based_thresholds": false,
"enable_transform": true,
"filter": {
"value_above": "",
"value_below": ""
},
"format": "none",
"name": "state",
"null_color": "darkred",
"null_value": "No data",
"pattern": "Influx.status_enum.*$",
"row_name": "_2_",
"thresholds": "1,3",
"time_based_thresholds": [],
"transform_values": "N/A|UP|?|DOWN|FAIL",
"valueName": "current"
},
{
"bgColors": "black|green|red",
"col_name": "_1_",
"decimals": 2,
"delimiter": ".",
"enable_bgColor": false,
"enable_time_based_thresholds": false,
"enable_transform": false,
"filter": {
"value_above": "",
"value_below": ""
},
"format": "s",
"name": "time",
"null_color": "darkred",
"null_value": "No data",
"pattern": "Influx.status_time.*$",
"row_name": "_2_",
"thresholds": "1,3",
"time_based_thresholds": [],
"transform_values": "N/A|UP|?|DOWN|FAIL",
"valueName": "current"
}
],
"plugin_title": "Boom Table",
"row_col_wrapper": "_",
"sorting_props": {
"col_index": -1,
"direction": "desc"
},
"targets": [
{
"alias": "Influx.status_enum.$tag_service",
"datasource": {
"type": "influxdb",
"uid": "000000001"
},
"groupBy": [
{
"params": [
"$__interval"
],
"type": "time"
},
{
"params": [
"service"
],
"type": "tag"
}
],
"measurement": "services_stats",
"orderByTime": "ASC",
"policy": "default",
"query": "SELECT \"status\" FROM \"services_stats\" WHERE (\"host\" = 'klapauzius' AND \"service\" = 'nfs-kernel-server') AND $timeFilter",
"rawQuery": false,
"refId": "K",
"resultFormat": "time_series",
"select": [
[
{
"params": [
"status"
],
"type": "field"
},
{
"params": [],
"type": "last"
}
]
],
"tags": [
{
"key": "host",
"operator": "=",
"value": "klapauzius"
}
]
},
{
"alias": "Influx.status_time.$tag_service",
"datasource": {
"type": "influxdb",
"uid": "000000001"
},
"groupBy": [
{
"params": [
"$__interval"
],
"type": "time"
},
{
"params": [
"service"
],
"type": "tag"
}
],
"measurement": "services_stats",
"orderByTime": "ASC",
"policy": "default",
"query": "SELECT \"status\" FROM \"services_stats\" WHERE (\"host\" = 'klapauzius' AND \"service\" = 'nfs-kernel-server') AND $timeFilter",
"rawQuery": false,
"refId": "A",
"resultFormat": "time_series",
"select": [
[
{
"params": [
"status_time"
],
"type": "field"
},
{
"params": [],
"type": "last"
}
]
],
"tags": [
{
"key": "host",
"operator": "=",
"value": "klapauzius"
}
]
}
],
"title": "Services",
"type": "yesoreyeram-boomtable-panel"
}
],
"refresh": "30s",
"schemaVersion": 37,
"style": "dark",
"tags": [],
"templating": {
"list": [
{
"current": {
"selected": false,
"text": "nanopineo3",
"value": "nanopineo3"
},
"datasource": {
"type": "influxdb",
"uid": "000000001"
},
"definition": "SHOW TAG VALUES FROM \"services_stats\" WITH KEY = \"host\"",
"hide": 0,
"includeAll": false,
"multi": false,
"name": "host",
"options": [],
"query": "SHOW TAG VALUES FROM \"services_stats\" WITH KEY = \"host\"",
"refresh": 1,
"regex": "",
"skipUrlSync": false,
"sort": 0,
"tagValuesQuery": "",
"tagsQuery": "",
"type": "query",
"useTags": false
},
{
"current": {
"selected": true,
"text": [
"All"
],
"value": [
"$__all"
]
},
"datasource": {
"type": "influxdb",
"uid": "000000001"
},
"definition": "SHOW TAG VALUES FROM \"services_stats\" WITH KEY = \"service\" WHERE host = '$host' ",
"hide": 0,
"includeAll": true,
"multi": true,
"name": "service",
"options": [],
"query": "SHOW TAG VALUES FROM \"services_stats\" WITH KEY = \"service\" WHERE host = '$host' ",
"refresh": 1,
"regex": "",
"skipUrlSync": false,
"sort": 0,
"tagValuesQuery": "",
"tagsQuery": "",
"type": "query",
"useTags": false
}
]
},
"time": {
"from": "now-1h",
"to": "now"
},
"timepicker": {
"refresh_intervals": [
"5s",
"10s",
"30s",
"1m",
"5m",
"15m",
"30m",
"1h",
"2h",
"1d"
],
"time_options": [
"5m",
"15m",
"1h",
"6h",
"12h",
"24h",
"2d",
"7d",
"30d"
]
},
"timezone": "",
"title": "SytemD Services Status",
"uid": "6wtmoQJmk",
"version": 12,
"weekStart": ""
}
Artikel, die hierher verlinken
Preisvergleich mit historischen Daten in Grafana
19.09.2023
Durch diesen Mastodon-Thread aufmerksam geworden, wollte ich da auch unbedingt mitspielen - allerdings habe ich gerade Urlaub und daher wollte ich klein anfangen...
Raspberry Pi 3B mit 64-Bit-Kernel
23.04.2023
Ich habe neulich wieder einmal Probleme mit meinem Raspi gehabt - oder genauer gesagt mit der darauf laufenden Influx-Installation.


![]()
![]()


![]()
Vor 5 Jahren hier im Blog
-
Fährnisse des Buildprozesses unter Windows
17.07.2019
Nachdem ich begonnen hatte, mich mit der Beschleunigung der Berechnung des Mandelbrot-Fraktals unter Zuhilfenahme der Shadereinheiten in Graphikkarten zu beschäftigen und erste Erfolge feiern konnte, wollte ich das mal auf einer richtigen Graphikkarte ausprobieren...
Weiterlesen...
Tags
Android Basteln C und C++ Chaos Datenbanken Docker dWb+ ESP Wifi Garten Geo Git(lab|hub) Go GUI Gui Hardware Java Jupyter Komponenten Links Linux Markdown Markup Music Numerik PKI-X.509-CA Python QBrowser Rants Raspi Revisited Security Software-Test sQLshell TeleGrafana Verschiedenes Video Virtualisierung Windows Upcoming...
Neueste Artikel
- Datenvalidierung UTF8 mit BiDi-Steuerzeichen (TrojanSource 2.0)
Ich bin heute nochmal inspiriert worden, weiter über die Trojan Source Vulnerability nachzudenken. Meiner Meinung nach bestehen hier noch Probleme - speziell bei Nutzereingaben oder Daten, die über externe Schnittstellen ampfangen werden.
Weiterlesen... - OpenStreetMap Navi als Docker-Container
Ich habe die auf OpenStreetMap basierende OpenSource Navigationslösung Graphhopper in einen Docker-Container gepackt und als neuestes Mitglied in meinem Docker-Zoo willkommen geheißen.
Weiterlesen... - SQL-Aggregatfunktionen in SQLite als BeanShell-Scripts
Ich habe neulich über eine Möglichkeit berichtet, SQLite mittels der sQLshell und Beanshell-Skripten um SQL-Funktionen zu erweitern. In diesem Artikel versprach ich auch, über eine solche Möglichkeit für Aggregatfunktionen zu berichten.
Weiterlesen...
Manche nennen es Blog, manche Web-Seite - ich schreibe hier hin und wieder über meine Erlebnisse, Rückschläge und Erleuchtungen bei meinen Hobbies.
Wer daran teilhaben und eventuell sogar davon profitieren möchte, muß damit leben, daß ich hin und wieder kleine Ausflüge in Bereiche mache, die nichts mit IT, Administration oder Softwareentwicklung zu tun haben.
Ich wünsche allen Lesern viel Spaß und hin und wieder einen kleinen AHA!-Effekt...
PS: Meine öffentlichen GitHub-Repositories findet man hier - meine öffentlichen GitLab-Repositories finden sich dagegen hier.